Start Building a Test Plan
First, start JMeter. Then let's start building a test plan. If you already have a test plan that you would like to start with, skip this section and move on to adding a Recording Controller to your Thread Group (the next section).
Minimally, we will want to add a Thread Group and HTTP Request Defaults. Let's get start by adding a Thread Group.
Add a Thread Group
Add a Thread Group to Test Plan:
- Right-click on Test Plan
- Mouse over Add >
- Mouse over Threads (Users) >
- Click on Thread Group
Set the Thread Group properties with the following values:
- Number of Threads (users): Set this to 50
- Ramp-Up Period (in seconds): Set this to 10.
- Loop Count: Leave this set to 1.

Add an HTTP Request Defaults
Now let's add HTTP Request Defaults to Thread Group:
- Select Thread Group, then right-click it
- Mouse over Add >
- Mouse over Config Element >
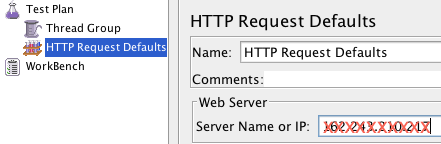
- Click on HTTP Request Defaults
In HTTP Request Defaults, under the Web Server section, fill in the Server Name or IP field with the name or IP address of the web server you want to test.
Add an HTTP Cookie Manager
If your web server uses cookies, you can add support for cookies by adding an HTTP Cookie Manager to the Thread Group:
- Select Thread Group, then right-click it
- Mouse over Add >
- Mouse over Config Element >
- Click on HTTP Cookie Manager
Add a Recording Controller
Now let's add a Recording Controller to Thread Group:
- Select Thread Group, then right-click it
- Mouse over Add >
- Mouse over Logic Controller >
- Click on Recording Controller
The Recording Controller is where recorded HTTP Request samplers will be created. The next step is to set up an HTTP(S) Test Script Recorder.
Add HTTP(S) Test Script Recorder
Now let's add an HTTP(S) Test Script Recorder to the WorkBench:
- Select WorkBench, then right-click it
- Mouse over Add >
- Mouse over Non-Test Elements >
- Click on HTTP(S) Test Script Recorder
Note: Items that are added to the WorkBench do not get saved with the rest of the test plan. If you want to save your WorkBench, right-click on WorkBench, then click Save Selection As..., and save it to your desired location. After it is saved, you may add it to any test plan that you have open by using the "Merge" menu item, and selecting your saved WorkBench.
Port Setting
The default port that the HTTP(S) Test Script Recorder proxy will run on is 8080. This can be changed by changing the Port setting under Global Settings.
Including or Excluding URL Patterns (Optional)
In the HTTP(S) Script Recorder, you may add URL Patterns, written as regular expressions, to include or exclude when you record. This can be useful to either include only the types of content you want to request (e.g. *.html, *.php, etc) or to exclude the types of content you do not want to request (e.g. *.jpg, *.png, *.js, etc).
To add a URL Pattern, click the "Add" button under the URL Patterns to Include or URL Patterns to Exclude section, then click on the top of the white area in the section. You should now be able to type in a pattern. Repeat the process to add more patterns.
Example: URL Patterns for webpages
.*\.html .*\.php .*\.htm Example: URL Patterns for images
.*\.png .*\.jpg .*\.gif Here is a screenshot of the URL Patterns to Exclude for excluding images:

Adding Items to the Script Recorder (Optional)
Adding JMeter items to a the HTTP(S) Test Script Recorder will make recorded requests inherit the added item. For example, if we add a Timer item to the Script Recorder, the Timer will be added to each HTTP Request that is recorded. When the test is run, the timer will cause each test thread to wait before performing the HTTP Request.
Let's add a Constant Timer to HTTP(S) Test Script Recorder, as an example:
- Select HTTP(S) Test Script Recorder, then Right-click it
- Mouse over Add >
- Mouse over Timers >
- Click on Constant Timer
You may configure the thread delay to whatever you desire.

Suppose that you want to simulate a user clicking on a different page every 2 seconds. Setting the thread delay to 2000 ms will accomplish this by adding a 2 second delay to each HTTP Request that is recorded.
This is just one example of how you can add items to the Script Recorder to help create a test plan that performs the tests that you desire.
Start Recording
Clicking on the "Start" button, on the bottom of the Script Recorder window, will start the JMeter proxy server which will be used to intercept and record browser requests. Click on the Start button (of the recorder) now.
The first time you attempt to run the recorder, it will display an error saying that it can't start because a certificate does not exist. Click OK, then click Start a second time. You should see a message that says that a temporary certificate named ApacheJMeterTemporaryRootCA.crt has been created in JMeter bin directory. Click OK and continue.

Note: If you browser already uses a proxy, then you need to configure JMeter to use that proxy before starting JMeter, using the command-line options -H and -P.
Configure Firefox To Use JMeter Proxy
We will use Firefox as our browser when using the JMeter HTTP(S) Test Script Recorder because, unlike Chrome and some other browsers, it does allows you to override system-wide configuration for its proxy settings.
Configure Firefox to use localhost (127.0.0.1) on port 8080 as its proxy for all traffic by following these steps:
- Open Firefox
- Go to the Preferences menu
- Click on the Advanced tab
- Then Network tab
- In the "Connection" section, click on "Settings..."
- Select the "Manual proxy configuration" radio button
- Set HTTP Proxy to "localhost" and Port to "8080"
- Check "Use this proxy server for all protocols"
- Click OK and exit the Preferences menu
Note: When Firefox is configured to use JMeter's Script Recorder as a proxy, it will only work properly if the Script Recorder is running.
Recording HTTP Requests
Now that our test plan's HTTP(S) Test Script Recorder is running, and Firefox is configured to use it as a proxy, the HTTP requests that Firefox sends will be recorded. Let's test it out.
In Firefox, go to your server's homepage (the same server that you configured in your JMeter HTTP Request Defaults):
http://your_domain.com/ Now there should be a little triangle next to your Recording Controller. Click on it to expand and show the requests that it has recorded. You should see the HTTP requests that were recorded, depending on which URL Patterns you have included and excluded. Feel free to browse your site to record more requests.
Here is an example of what was recorded when visiting the homepage of a WordPress site (with no URL Patterns set):

As you can see, a lot of requests were created. You may refine the list of HTTP requests by simply deleting unwanted entries here.
If you do not see any entries under your Recording Controller, you will want to review your URL Patterns in the HTTP(S) Test Script Recorder (Hint: Remove all includes and excludes to record everything).
Once you are done recording, click the "Stop" button at the bottom of the HTTP(S) Test Script Recorder window. Note that Firefox will no longer be able to reach any pages (because it is configured to use port 8080 as a proxy)--configure it to use "No proxy" if you want to function normally.
Run Your Test Plan
Once you are happy with the test plan you have recorded, save it, then run it. It will function exactly like a manually created test, so you can configure it, delete, and add items to make it match your desired test case more closely.


